Interpreting:Just for Laughs
Unrealistic economics
A Silly, Feel-Good Chart: Earning Per Hour Interpreted
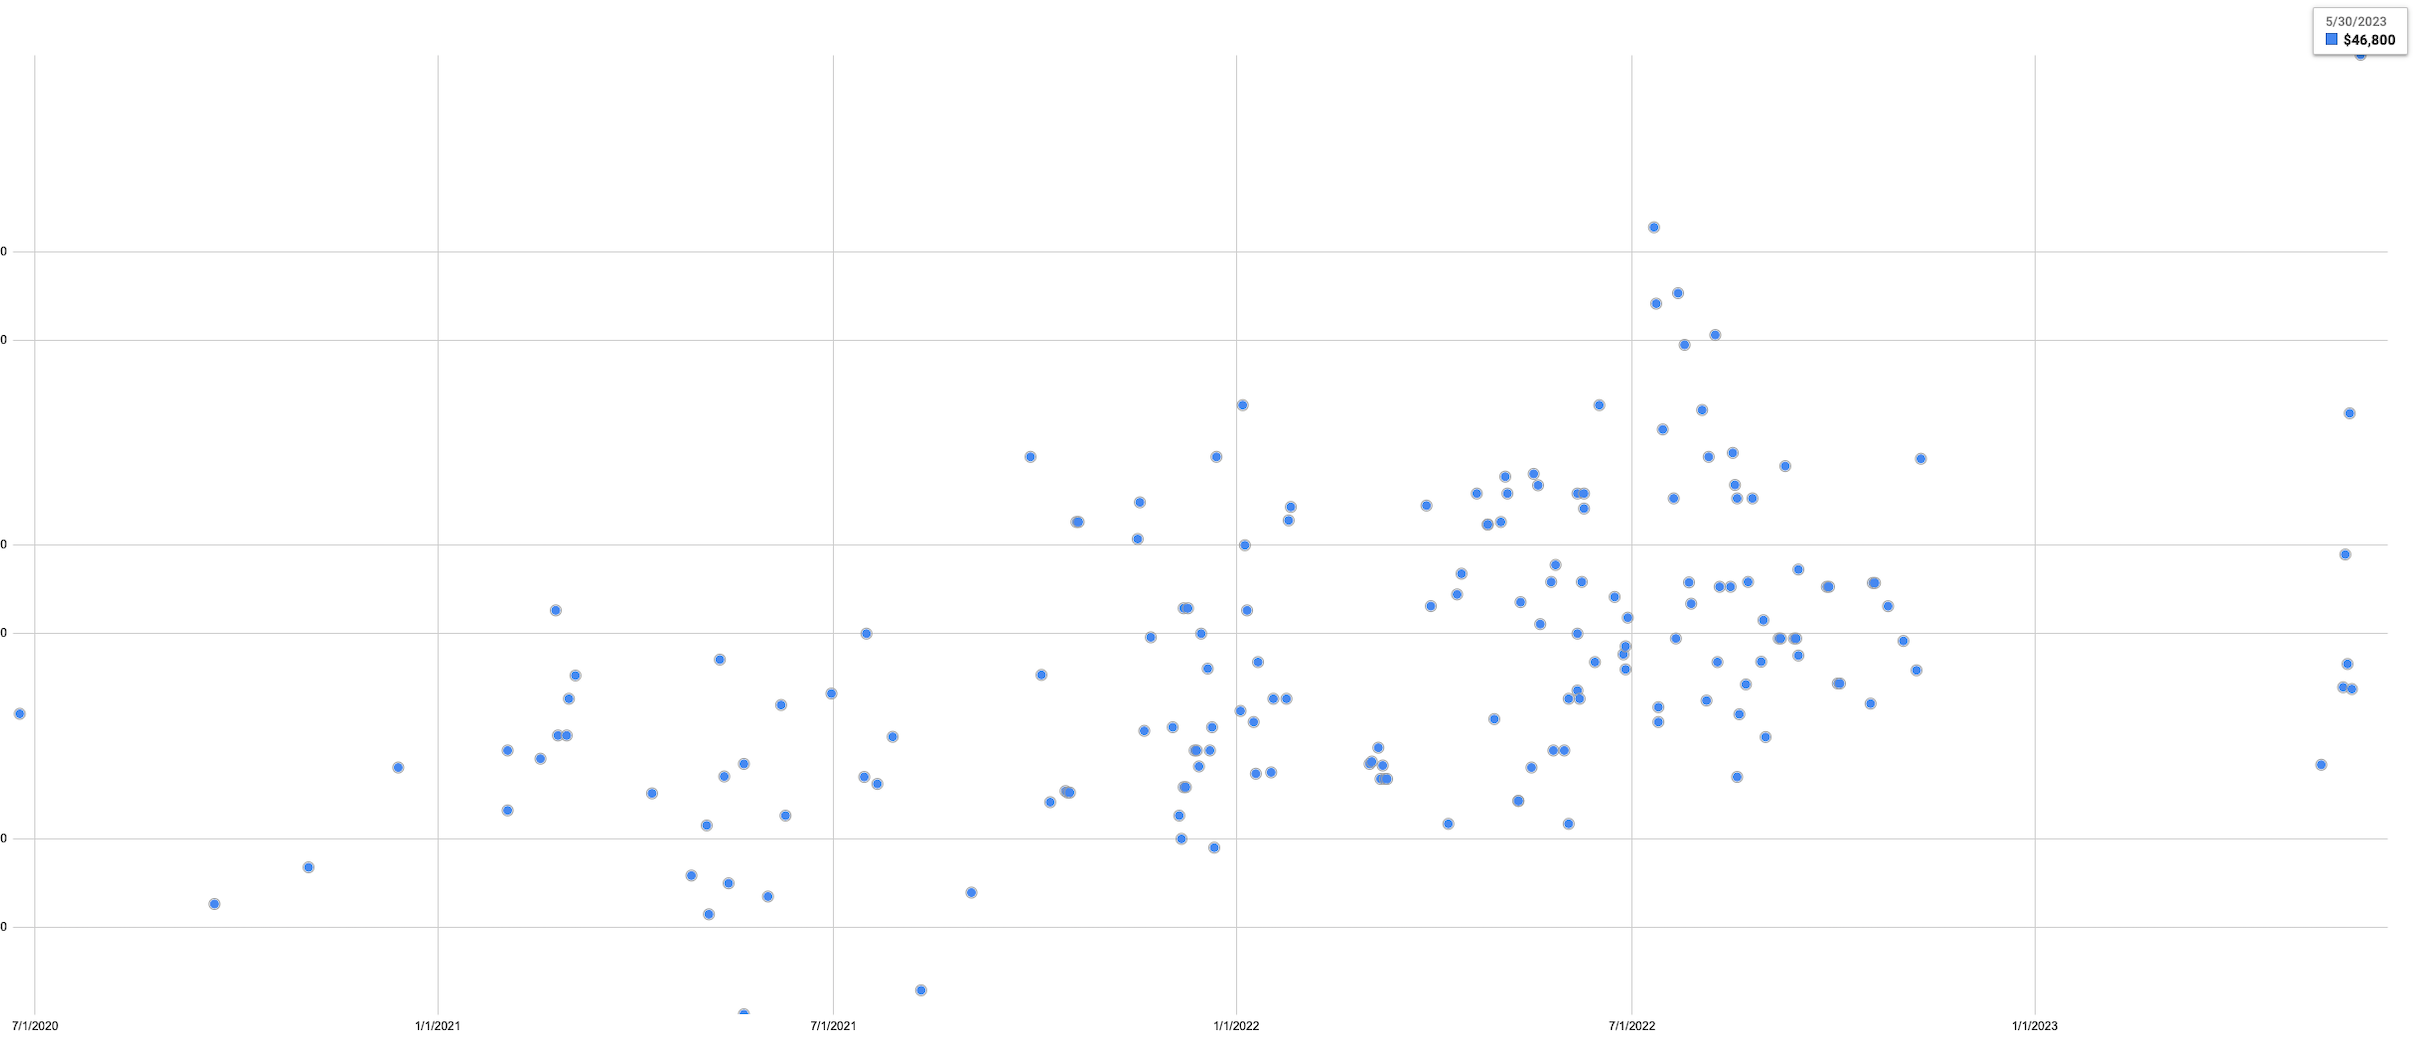
Yesterday (May 30, 2023), my chart registered a record-high number: earning per hour interpreted. The operative word being "interpreted." This means, time spent interpreting is always somewhat less than the time "on the job": I may be employed online or on-site for an assignment, but if for some reason my interpretation isn't needed, such as when I am asked to simply stand by, ready to jump in to interpret, when I am taking a break as the booth partner interprets, when I am the "check interpreter" in a deposition, or when someone I am hired to help communicate decides to listen to and speak English on their own, that time of no actual interpreting does not count toward the denominator of this calculation.
To give a concrete example: On that "lucrative" job of May 30th, the person needing help decided to just listen to the English questions and answer in English himself, with me and my interpreter partner simply present, standing by, still listening actively and ready to jump in to help when he says "I need interpretation," but otherwise in a mentally more relaxed state than active interpreting. The occasional need for my interpretation did occur twice: once to help interpret a really simple request from the technician to adjust the camera angle, another time when I felt duty-bound to proactively offer a factual and basic correction of an incorrect number uttered by my partner. So I counted and rounded up my interpretation time as 5 minutes, in a job that ended way early in 3 hours while the client scheduled us for many more hours. In the end, We got paid for the scheduled duration (the only reasonable thing to do), but I interpreted for 5 minutes. The result is an astronomical ratio of $47,000 earned per hour interpreted, as shown at the top-right corner of the chart.
Like I said, this happens rarely but it does happen. Consider it one of the few sweet surprises of being a freelancer, among the many more terrible conditions and challenges of a profession full of uncertainties. You can never predict when it'll happen, but its possibility is perhaps what makes the generally harsh conditions a bit more tolerable. 有苦也有甘, as we say it in Chinese.
In case you're curious, the Y-axis of the chart is logarithmic for easier viewing, because the range is huge and wide, from the sweat-shop level of $25/hour to the stratosphere.
For the mathematically tuned interpreter colleague or by-stander, you may want to ask: what if you get paid some money for a job scheduled but canceled late? Where are those dots in this graph? Don't you get such paid cancellations? The answer is, yes, I do occasionally get paid for the minimum fee if a job is canceled late. But because the denominator for those situations will be zero (no time in which I interpreted), the ratio will be infinity, or in mathematical or Excel's term, a divide-by-zero error. These dots are not shown in the chart.
I'll end by saying again that this is really just a silly way of looking at the way I earn money, and that I maintain this chart only to enjoy occasional moments of feeling good, as it makes the often harsh conditions chafe a bit less. A much more realistic way of plotting a chart for earning by an interpreter is to look at average earning per hour spent on the job, including preparation, travel, waiting, listening, interpreter, lunch breaks, etc. And, before you ask, yes, I also keep a chart of that, and a third type of chart too, designed to help me see the difference in reward/return on time investment between general simultaneous conferences and everything else. Want to venture a guess as to what my third chart measures?